Instagram Follower Loss by Niche: 2026 Comparison

Not all niches lose followers at the same rate. A pet account and a fashion account with the same follower count will see very different unfollow numbers each month. The reasons differ too.

2026 data from 63 million posts across 600K+ accounts puts the average instagram engagement rate by niche into context. The overall average is 1.22%. But that hides huge gaps. Photography: 1.99%. Pets: 2.00%. Fashion: 1.24%. Beauty: 1.19%. Tight communities like volleyball (5.9%) and running (5.1%) blow past all of them.

These gaps predict follower retention instagram accounts can expect. High engagement means people care. Low engagement means they're one shift away from unfollowing.

Here's an instagram niche comparison of seven major categories — with real numbers, loss patterns, and fixes that work.

What Counts as Normal Follower Loss?

Losing 1-2% of followers per month is normal for any established account. For accounts growing between 1K-5K, an instagram unfollow rate up to 3% is healthy. Don't panic over small dips.

The key metric is your 30-day retention rate. Above 90% is great. Below 80% means too many of your new followers are bots, pod accounts, or people who wanted a followback and left when it didn't come.

The causes of follower loss repeat across every niche. Inactivity is the biggest: 44% of all unfollows happen because people stop using the app (HubSpot data). Posting too often drives 18%. Banned hashtags cause 17% of drops by killing reach. Bot cleanups remove about 20% — those aren't real losses, just fake accounts gone.

And 79% of users unfollow brands they've lost interest in. The content stopped matching why they followed. Understanding why people unfollow helps identify which patterns apply to your niche.

Here's how that plays out by niche.

Fitness: The January Mirage

Fitness is the most seasonal niche on Instagram. Every January, New Year's resolution traffic floods fitness accounts with new followers. By March, motivation fades. By summer, the accounts that gained 5-10% in January have often given back half of it.

Fitness engagement hovers around the average — roughly 1.2-1.4%. That means the niche doesn't build strong loyalty on its own. The content problem: too many workout clips, transformation photos, and supplement posts. Once followers have seen 200 squat variations, they scroll past the 201st.

The deeper issue is hype. Accounts that promise fast results attract followers who leave when those results don't show up. This creates a loop: gain with hype, lose when reality hits.

What actually reduces fitness churn:

  • Diversify formats aggressively — mix Reels (which average 3.8% engagement, roughly 3-5x higher than static posts), nutrition content, and client stories
  • Drop the "6-week transformation" framing. Sustainable progress content retains better than before/after shock value
  • Post 4-5 times per week maximum. Fitness audiences unfollow for overposting faster than most niches

Fashion: Fast Content, Faster Exits

Fashion sits below average at 1.24% engagement. The reason: fashion content expires fast. A trending outfit from two weeks ago already looks dated. A seasonal lookbook dies the moment the season shifts.

This puts fashion accounts on a treadmill. They need to post a lot to stay relevant, but high volume with low originality speeds up unfollows. Accounts that copy trending Reels without adding a real point of view bleed followers the fastest.

Monthly instagram churn rate in fashion runs 2-3% for mid-size accounts. The audience is also more volatile because trends attract trend-followers, not loyal fans.

What actually reduces fashion churn:

  • Build a personal style that outlasts trends. Followers stay for a point of view, not trend reports they can get anywhere
  • Front-load value in Reels — the first 1-2 seconds decide if someone watches or scrolls
  • Post less, but better. Three strong posts per week beat seven weak ones

Food: The Recipe Complexity Trap

Food is one of the most crowded niches on Instagram. The visual bar is high. Hundreds of accounts post the same overhead shots of plated dishes.

The main churn driver is recipe complexity. Accounts with elaborate, multi-step recipes and rare ingredients attract follows for the visuals — then lose followers when people realize they'll never cook the food. Quick recipes (under 30 minutes, common items) retain much better than fancy cuisine content.

Accounts that post only one cuisine type hit a ceiling fast. The narrow focus limits the audience, and once followers save a few recipes, the reason to stay fades.

What actually reduces food churn:

  • Build content around what people actually cook: weeknight dinners, meal prep, budget-friendly ingredients
  • Use Reels for step-by-step process videos — they outperform static food photography for retention
  • Create themed series ("5-ingredient Fridays," "Under 20 minutes") that give followers a reason to come back on specific days

Travel: When the World Decides Your Churn Rate

Travel is the niche most affected by outside forces. Economic shifts, travel bans, fuel prices, visa changes — all of these move follower behavior overnight. When people can't afford to travel, they unfollow travel accounts. Not personal. Practical.

Seasons make it worse. Engagement spikes during booking season (January-February, September-October) and drops off-peak. Luxury travel accounts are hit hardest by economic shifts. Local and budget travel content retains better.

The other travel-specific problem: content aging. A Bali guide from 2024 goes stale fast. Followers want current prices, visa rules, and real reviews — not outdated "best of" lists.

What actually reduces travel churn:

  • Add a local content layer next to the big trips. Local travel is recession-proof
  • Update evergreen guides with current info instead of letting them go stale
  • Personal stories keep followers even when they're not planning trips. The story matters more than the place

Business & B2B: The Giveaway Hangover

Business accounts face a pattern unique to their niche: the giveaway cycle. Run a giveaway, gain 500 followers in 48 hours, lose 400 over the next two weeks. Prize-seekers have zero interest in the content. This is among the worst drivers of losing followers by industry. This mirrors the pattern of losing followers after ads and giveaways.

Beyond giveaways, ad fatigue drives the most unfollows. When every post is a sales pitch, 79% of users will leave. The accounts that survive treat Instagram as a value channel first and a sales channel second.

B2B engagement rates cluster around 0.8-1.1%, well below average, because the content appeals to fewer people. That's not always a problem — B2B followers can be high-value even in small numbers. But every unfollow hits harder.

What actually reduces business churn:

  • Follow the 80/20 rule: 80% value (tips, case studies, behind-the-scenes), 20% promo
  • Stop running giveaways for follower count. They produce vanity numbers that reverse in weeks
  • Show customer results instead of product features. Social proof retains better than ads
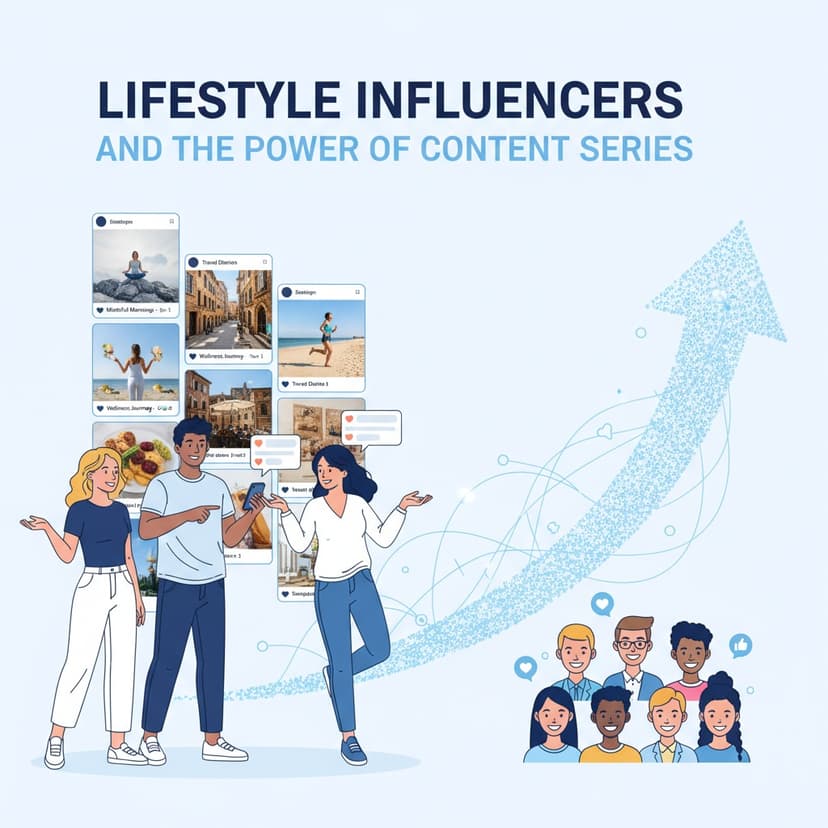
lifestyle influencers and the power of content series

Lifestyle: When Your Life Changes, Your Audience Changes

Lifestyle is the most personal niche on Instagram. Followers attach to a version of the creator's life — routines, looks, relationships, location. When any of those change, some of the audience leaves. The account no longer matches what they signed up for.

This is the "series effect." Followers treat lifestyle accounts like shows. Marriage, kids, moving, career changes — each shift triggers unfollows from people who liked the old season. It's not a quality issue. It's an identity shift.

Lifestyle also has a broadness problem. "Lifestyle" covers everything, which means it can cover nothing well. Without a clear focus, followers drift because there's no strong reason to stay.

What actually reduces lifestyle churn:

  • Be open about life changes instead of making abrupt shifts. Bring the audience along
  • Pick 2-3 content pillars within lifestyle (routines + home design + reading, for example) so the account has identity beyond "my daily life"
  • Talk to followers through polls, Q&As, and replies. In personal niches, interaction is the retention tool

Pets & Animals: The Retention Champion

Pets sit at the top of the charts: 2.00% engagement, well above the 1.22% average. This niche has the lowest instagram churn rate of any major category. The reason is simple: emotional content sticks. People don't unfollow a golden retriever because they're "no longer into the brand."

Pet accounts have a built-in edge. The subject is engaging on its own. No trend-chasing needed. Saves and shares run higher than most niches. Followers tolerate the same formats (another photo of the cat sleeping) in ways they wouldn't for fitness or fashion.

Monthly churn for pet accounts stays below 1%. The main risks are too many sponsored posts (which break the feel) and going quiet (even loyal followers leave if content stops).

What actually reduces pet churn (from an already low baseline):

  • Keep sponsored content under 15-20% of total posts. Pet audiences are especially sensitive to commercial shifts
  • Use Reels for short, shareable moments — pet Reels have some of the highest send-per-reach rates on the platform
  • Let the animal's personality drive the account. Captions and branding matter less here than in any other niche

The One Signal That Matters More Than Follower Count

Adam Mosseri has said follower count is no longer a strong predictor of reach. The metric that matters in 2026 is sends per reach — how many people share your content in DMs relative to views. The Instagram algorithm now prioritizes engagement quality over raw follower count.

This changes the instagram follower loss by niche conversation. Losing followers matters less if your remaining audience shares your content. A 10K fitness account with high DM shares will beat a 100K fashion account with low shares.

Niches that naturally drive DM shares — pets, food, humor — have a built-in edge. Niches that don't — B2B, fashion — need to create content worth sending, not just liking.

To track your own follower retention instagram data — who unfollowed and when — Unfollowers Tracker shows exactly who dropped off. You can match losses to specific posts or time periods instead of guessing.

Niche-by-Niche Comparison Table

NicheEngagementMonthly ChurnTop Loss DriverBest Fix
Fitness1.2-1.4%2-3%Repetitive contentMix formats; cap 4-5x/week
Fashion1.24%2-3%Content expires fastOwn a style; quality > volume
Food1.3-1.5%1.5-2.5%Recipe complexitySimple recipes; process Reels
Travel1.2-1.5%1.5-3%Economy shiftsAdd local content layer
B2B0.8-1.1%2-4%Ad fatigue; giveaways80/20 value-to-promo split
Lifestyle1.1-1.4%1.5-2.5%Life changesKeep 2-3 content pillars
Pets2.00%<1%Over-sponsoringKeep ads under 15-20%

F.A.Q.

What is a normal Instagram unfollow rate?

Losing 1-2% of your followers per month is normal for established accounts. For accounts actively growing in the 1K-5K range, up to 3% monthly churn is healthy. If you're losing more than that consistently, something specific is driving people away — check your content mix, posting frequency, and whether recent hashtags might be banned.

Why am I losing followers on Instagram?

Sudden drops come from four main sources: bot cleanups by Instagram (about 20% of drops), a content shift that doesn't match what followers signed up for, banned hashtags that kill your reach, or a viral post that pulled in the wrong crowd. Check what you posted recently — 79% of people unfollow brands they've lost interest in.

Which Instagram niche loses the most followers?

Business and B2B accounts see the highest churn rates, especially those that run giveaways. Fashion is close behind — content expires fast and trend-chasers don't stick around. Pets and animals have the lowest churn, with monthly loss under 1%.

Does posting frequency affect follower loss?

Yes. 18% of users unfollow for too-frequent posts. The limit varies by niche — fitness and fashion crowds handle more posts than lifestyle or B2B fans. Most accounts see falling returns past 5-7 posts per week. But going quiet is worse: 44% of follower loss comes from accounts that stopped posting.

How do I know if my follower loss rate is too high?

Track your 30-day retention rate. Above 90% is great. 80-90% is fine for growing accounts. Below 80% is a red flag — it usually means follow-and-unfollow traffic, bot cleanups, or a mismatch between your content and what followers expected.

Are Reels better than static posts for keeping followers?

Yes. Reels get 3-5x higher engagement than static posts — 3.8% average vs. 1.22% overall. For retention, the key is DM shares. Reels drive more sends per reach, which is the top signal for reach on Instagram in 2026. Accounts that moved to Reels-heavy plans report better retention across every niche.

Bottom Line

Instagram follower loss by niche follows clear patterns. A pet account at 1% monthly churn is doing well. A business account at 4% after a giveaway has a strategy problem, not a content problem. Emotional, tight-knit niches retain. Trend-driven and promo-heavy niches churn.

The best response to losing followers by industry isn't chasing the number back up. It's knowing who left, why, and whether your content reaches the people who want it. In 2026, DM shares matter more than follower count. Build for shares, not for follows, and retention follows.

Track Your Instagram Unfollowers

Discover who stopped following you and optimize your growth strategy with our free tool.

Discover Unfollowers

We use cookies. Policy